第14代Intel Core桌上型处理器来了,如你所知处理器的架构与制程并未改变,也维持搭配700系列芯片组主板,来瞧瞧这微妙的改朝换代,以及搭配ROG Maximus Z790 Dark Hero实测表现。
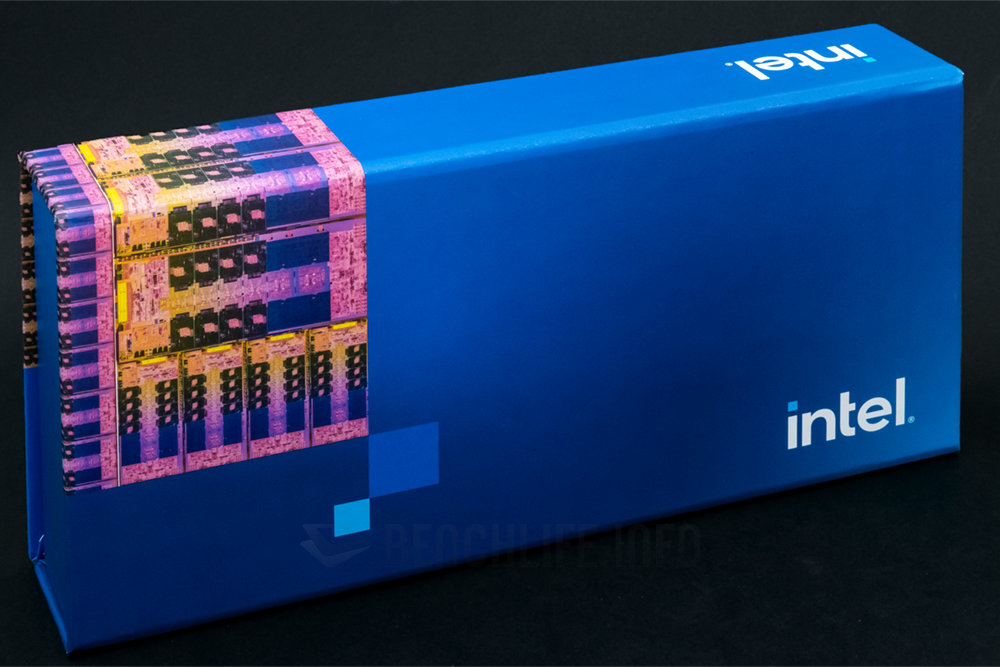

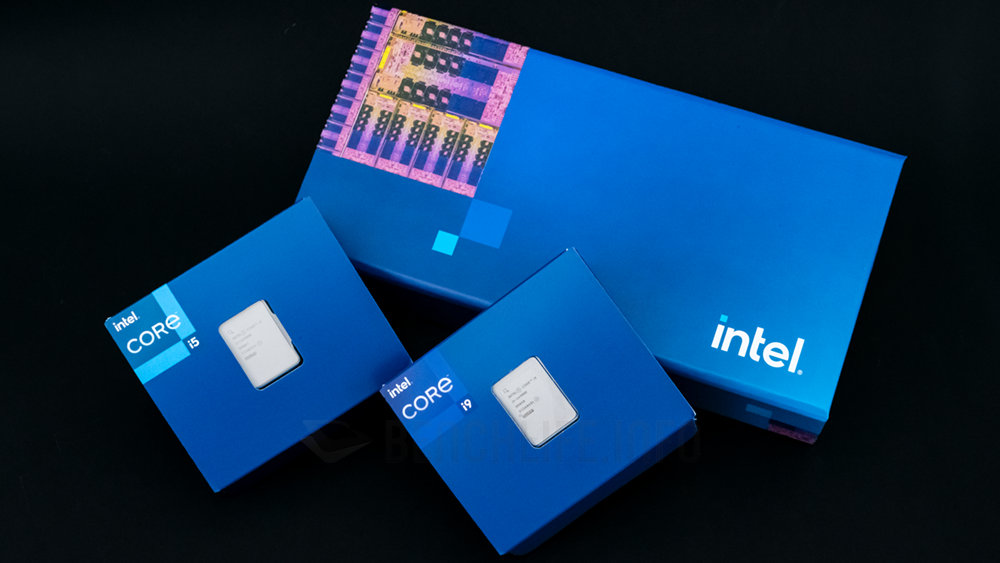
延续最近几代媒体测试样品的作法,Intel 为 14 代 Intel Core 桌上型处理器设计了独特包装,那主视觉和 13 代样品相仿,Intel 招牌蓝色纸盒印制着芯片透视图。
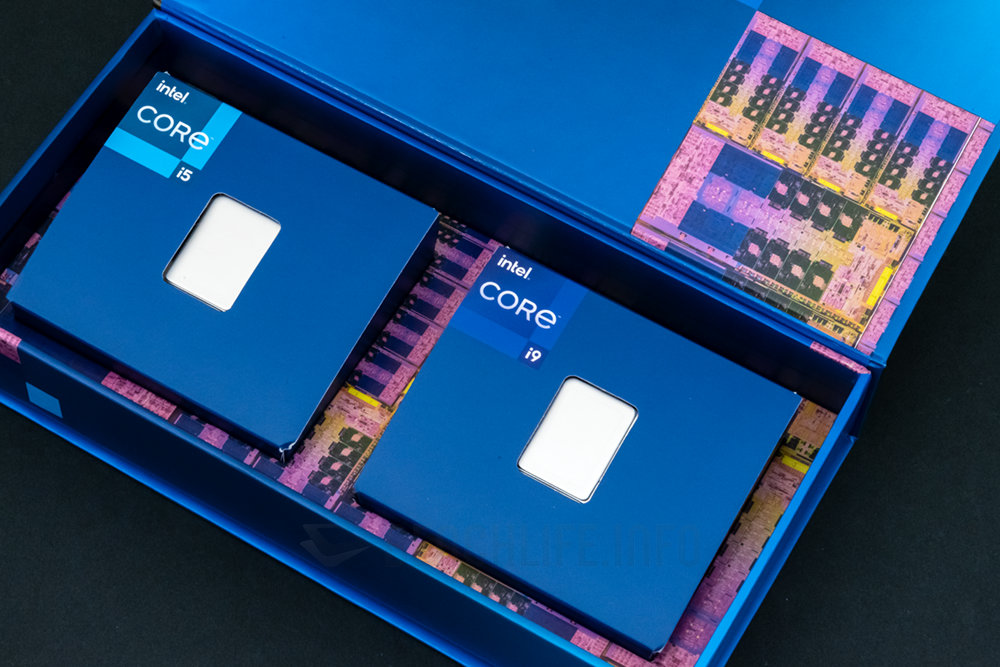
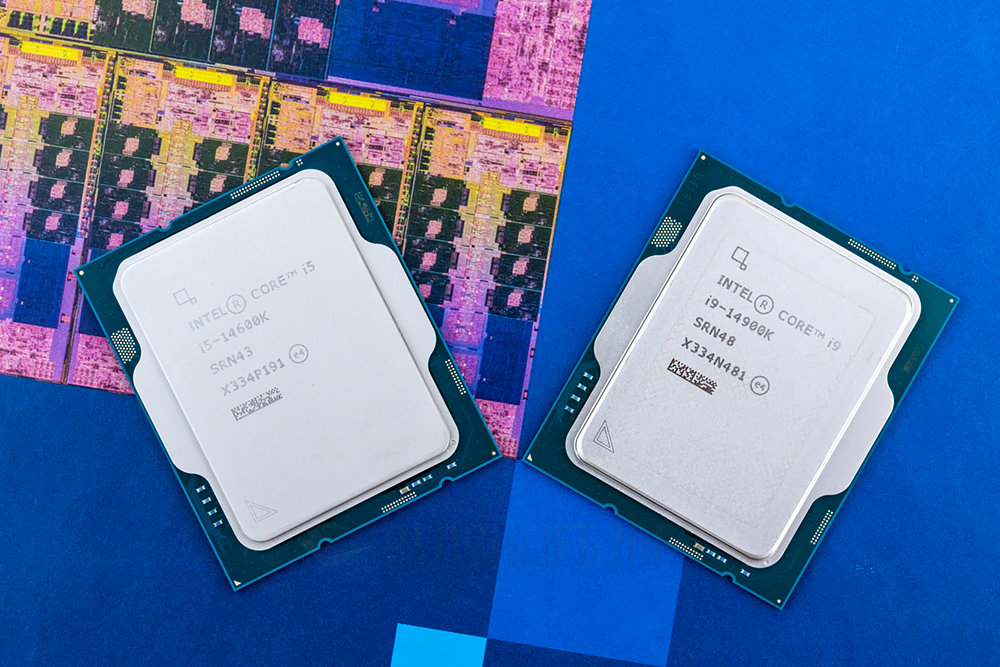
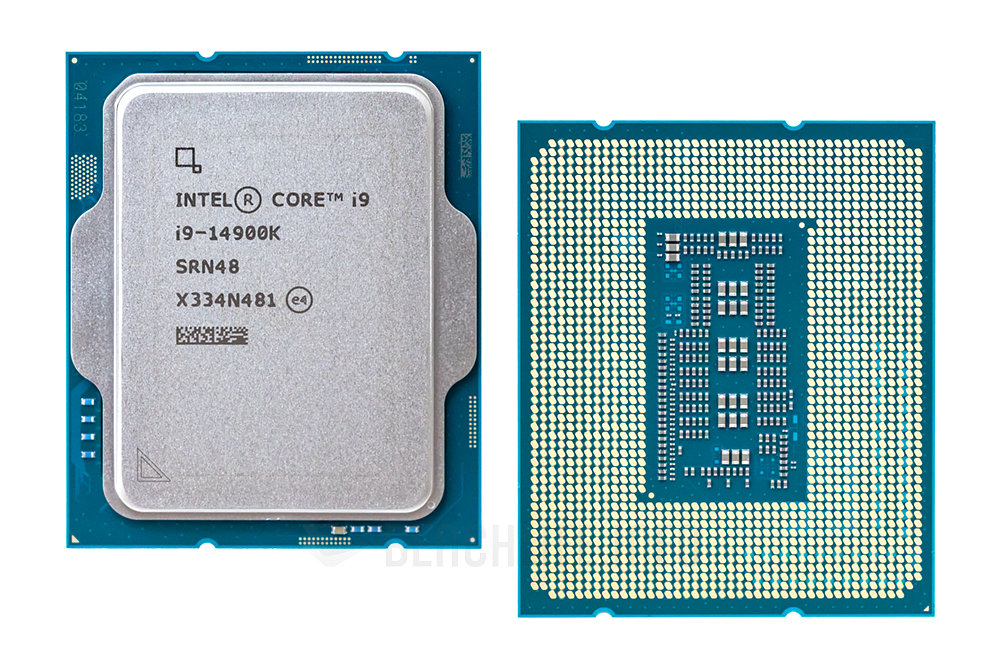
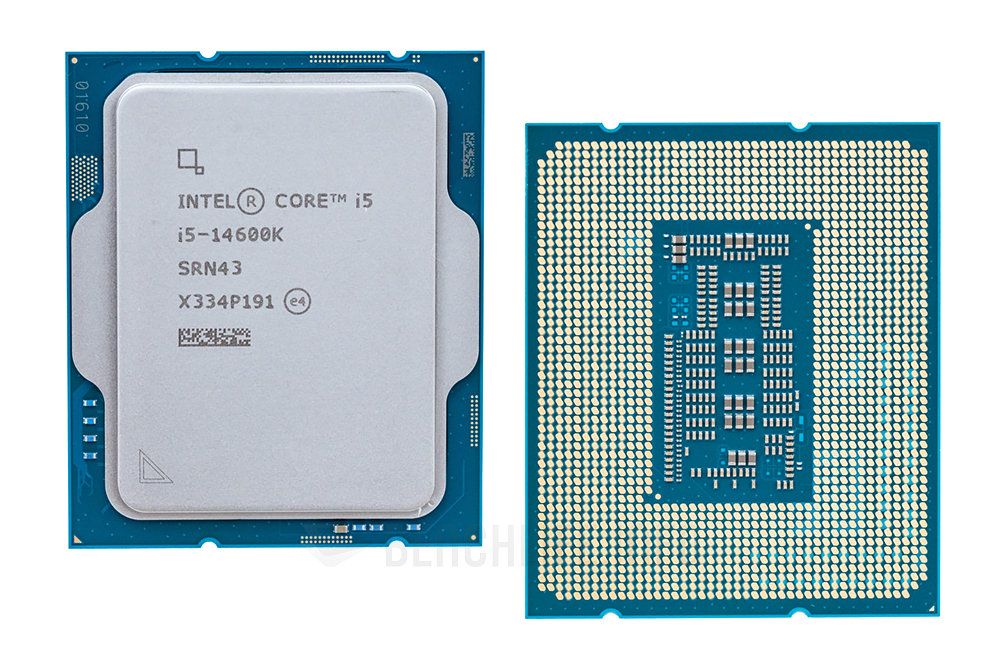
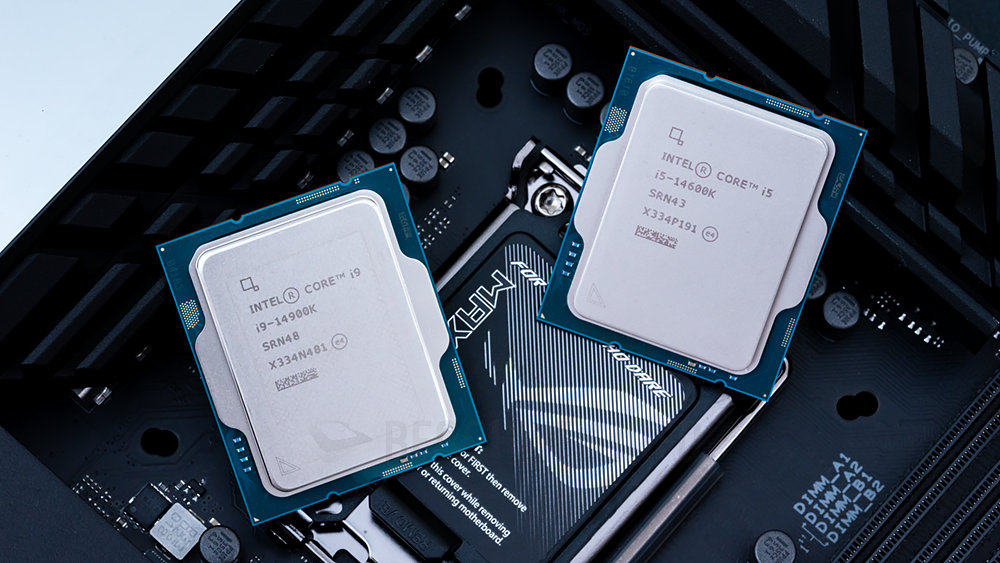
Intel 一贯提供高阶、主打产品,想当然耳也会是 K 版不锁频款式,Core i9-14900K 与 Core i5-14600K 静默躺在独特包装盒内,后续将和前代同级产品实测比较。
14 代Intel Core 桌上型处理器
第12、13、14代Intel Core桌上型处理器拥有相同DNA,作为始祖的第12代(代号Alder Lake)首度采用效能混合架构设计,包含全新LGA 1700脚位、600系列芯片组。
而第13(代号 Raptor Lake)、14 代(代号 Raptor Lake Refresh)都是它的延伸,第 13 代推出时还新带来 700 系列芯片组,至于第 14 代则是维持既有配套措施。
藉由Refresh微更新再战一年的第14代,相对好处是兼容于600、700系列芯片组主板,各代之间可以无痛交叉搭配使用,主板厂也有跟着推出一些更新产品。
就这次的样品来讲,Core i9-14900K与Core i9-13900K、Core i5-14600K和Corei5-13600K之间的关联式,新品都是预设时脉再往上拉,第14代产品线大致上也如此(仅Core i7-14700K/KF还多增加4个E-core)。
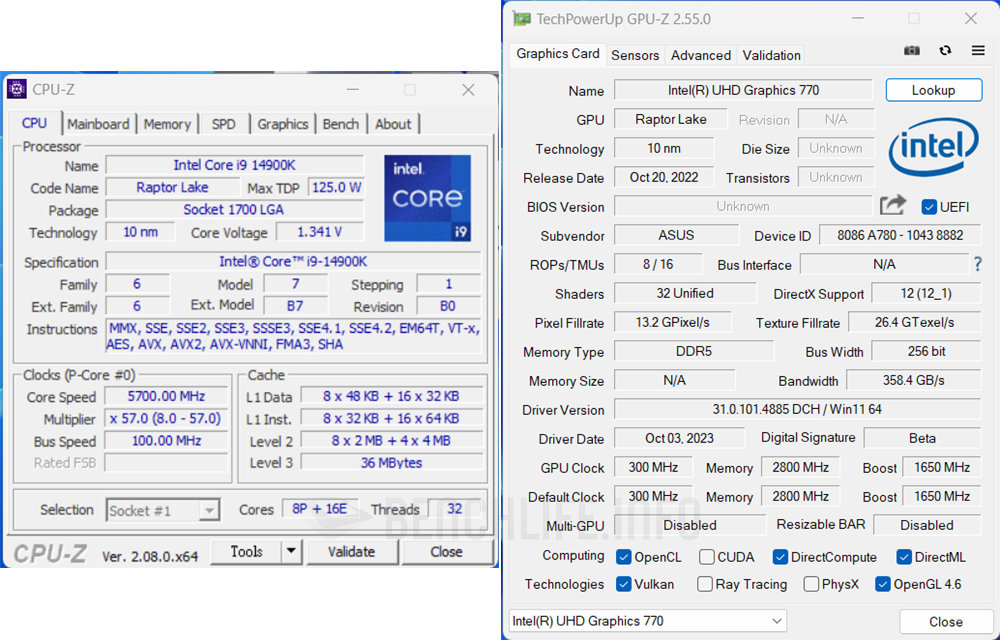
Core i9-14900K 时脉最高达 6GHz(P-Core、Intel TVB 模式、1~2 核),不过 6GHz 标的先前已经由 Core i9-13900KS 达成,Core i9-14900K 则具有其他略高的加速时脉(Intel Turbo Boost 等)。
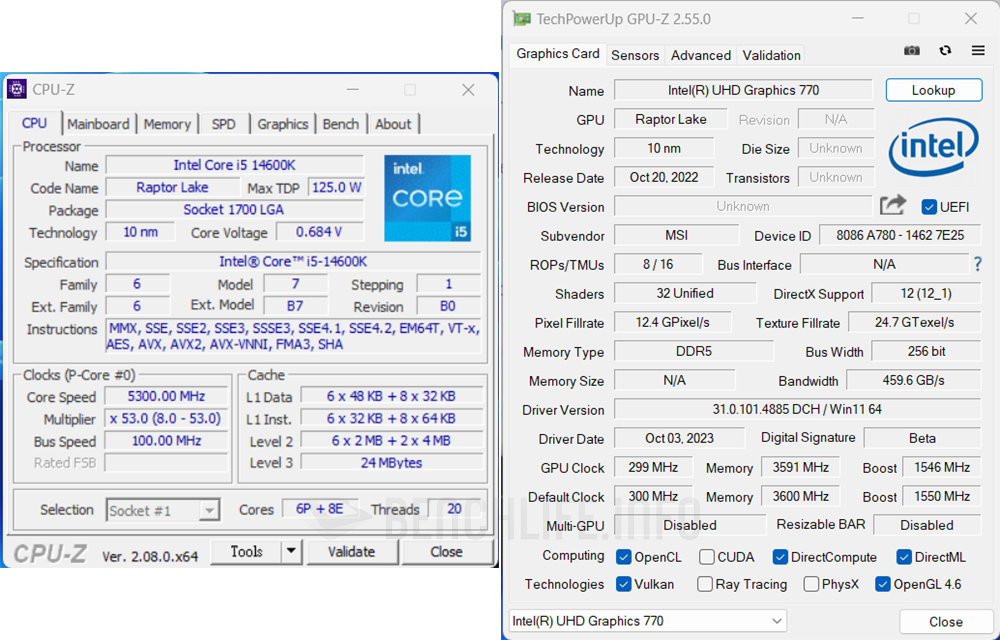
Core i5-14600K 同理,Intel 仍未下放 Intel TVB、Intel Turbo Boost Max Technology 3.0 等技术,除了 Intel Turbo Boost 加速时调高至 5.3GHz(P-core),包含 E-core、基础时脉也都略高于前代。
当然有些人亏Intel更新都靠「电」上去的,也就是牺牲功耗来换取性能,Core i9-14900K和Corei5-14600K基础功耗同为125W、加速功耗分别是253W、181W,片面而言是维持和前代相同标准。
| 处理器简要规格 | i9-14900K | i9-13900KS | i9-13900K | i9-12900K | i5-14600K | i5-13600K | i5-12600K |
|---|---|---|---|---|---|---|---|
| 核心数量 | 24C / 32T | 24C / 32T | 24C / 32T | 16C / 24T | 14C / 20T | 14C / 20T | 10C / 16T |
| P-core 数量 | 8 | 8 | 8 | 8 | 6 | 6 | 6 |
| E-core 数量 | 16 | 16 | 16 | 8 | 8 | 8 | 4 |
| Smart Cache | 36MB | 36MB | 36MB | 30MB | 24MB | 24MB | 20MB |
| L2 Cache | 32MB | 32MB | 32MB | 14MB | 20MB | 20MB | 9.5MB |
| Intel TVB | 6.0GHz | 6.0GHz | 5.8GHz | – | – | – | – |
| ITBM 3.0 | 5.8GHz | 5.8GHz | 5.7GHz | 5.2GHz | – | – | – |
| P-core ITB | 5.6GHz | 5.4GHz | 5.4GHz | 5.1 GHz | 5.3GHz | 5.1GHz | 4.9GHz |
| E-core ITB | 4.4GHz | 4.3GHz | 4.3GHz | 3.9GHz | 4.0GHz | 3.9GHz | 3.6GHz |
| P-core 基础时脉 | 3.2GHz | 3.2GHz | 3.0GHz | 3.2GHz | 3.5GHz | 3.5GHz | 3.7GHz |
| E-core基础时脉 | 2.4GHz | 2.4GHz | 2.2GHz | 2.4GHz | 2.6GHz | 2.6GHz | 2.8GHz |
| 基础功耗 | 125W | 150W | 125W | 125W | 125W | 125W | 125W |
| 加速功耗 | 253W | 253W | 253W | 241W | 181W | 181W | 150W |
那么还有什么新鲜事? Intel 另外加入了Extreme Power Delivery Profile,作用是指定处理器的ICCMax电流量供应上限新策略,完全喂饱处理器所需有利于提高性能。
不过Intel目前只为Corei9-14900K/KF提供307A和400A配置,使用上也得视散热器性能(Intel建议至少使用360mm AIO水冷),以及主板厂的实际设置而定。

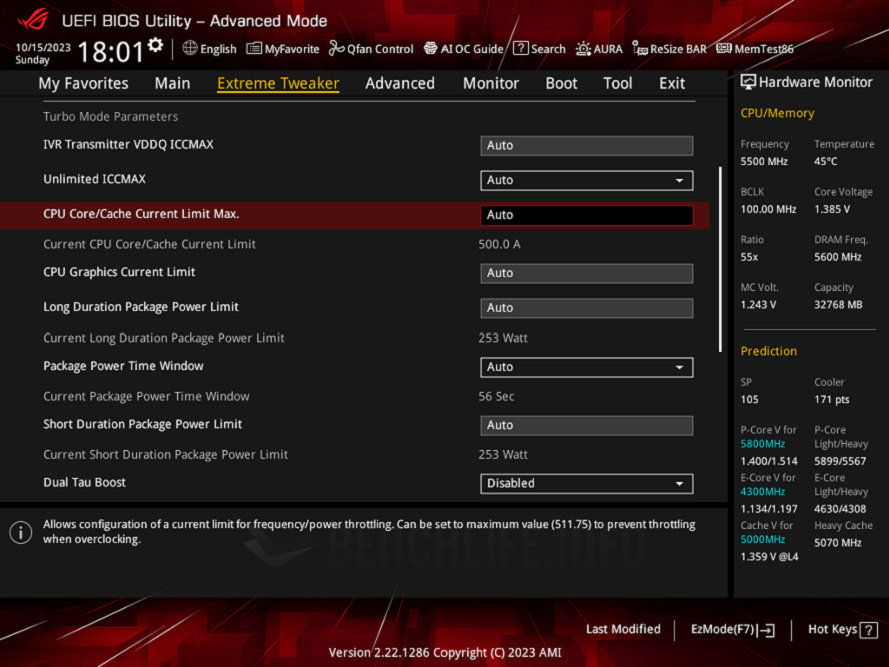
图例ASUS ROG Maximus Z790 Dark Hero的ICCMax选项默认为500A。
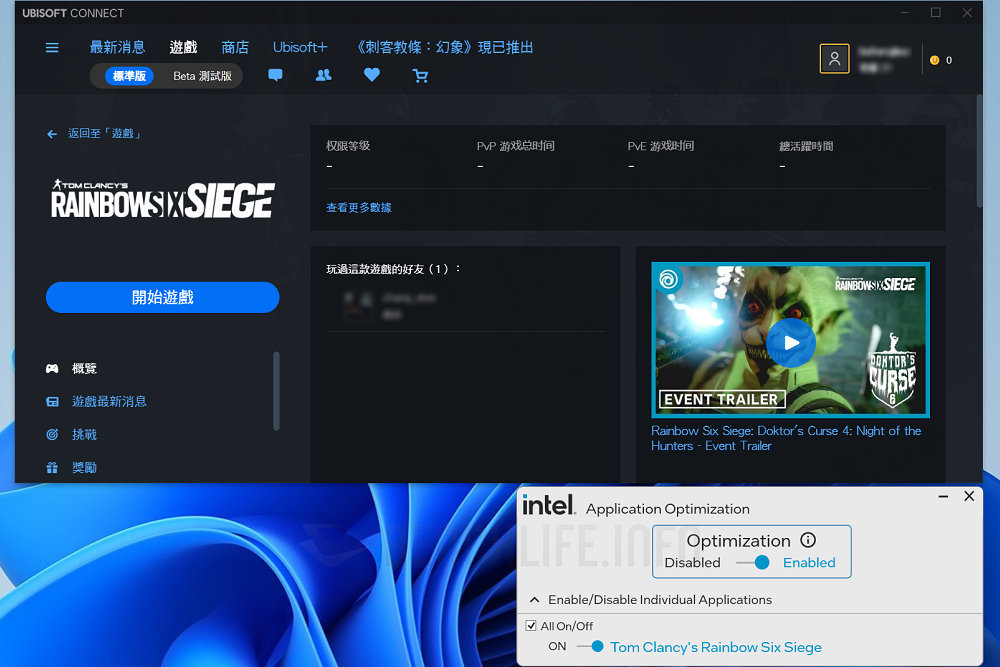
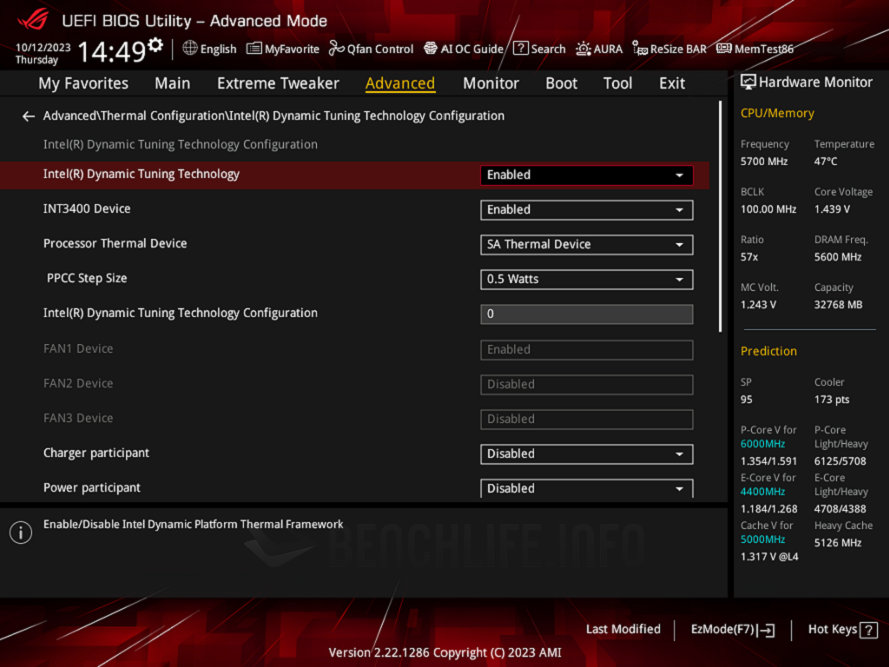
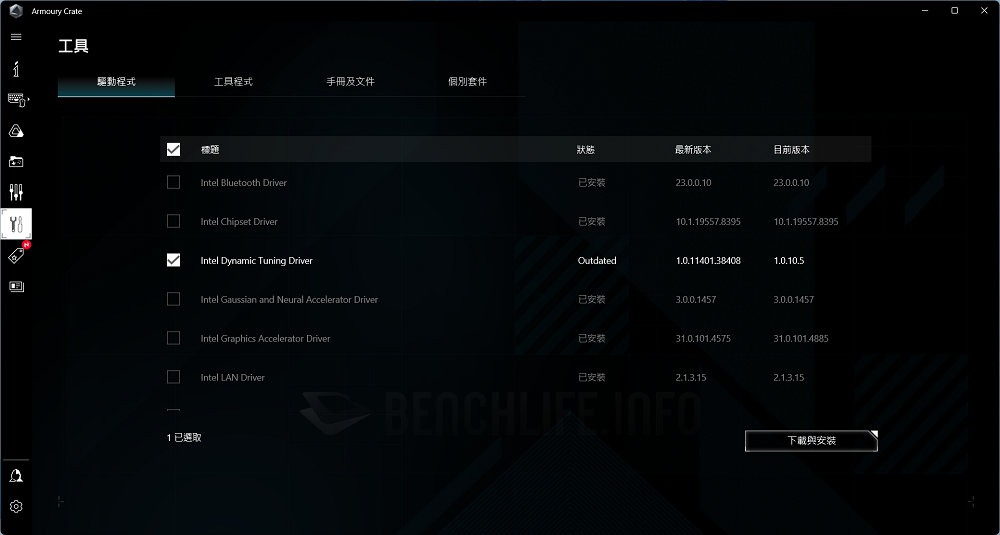
Intel 在韧、软件层还有一些作为,包含 Intel Application Optimization(Intel APO)和 Intel Dynamic Tuning Technology(Intel DTT)等功能,只不过当下限定支持 Core i9-14900K / KF,就看 Intel 后续是否愿意下放给所有 K 版不锁频处理器。
Intel Application Optimization 作用大意上来说,可以进一步优化 Intel Thread Director 线程调度 / 排程,使用它必须同时开启 Intel DTT 功能。 而且存在软件兼容性、支持程度限制,Intel 指出当前有 Rainbow 6 Siege、Metro Exodus 这 2 款游戏支持,效益是能够提高画面帧数(FPS)。
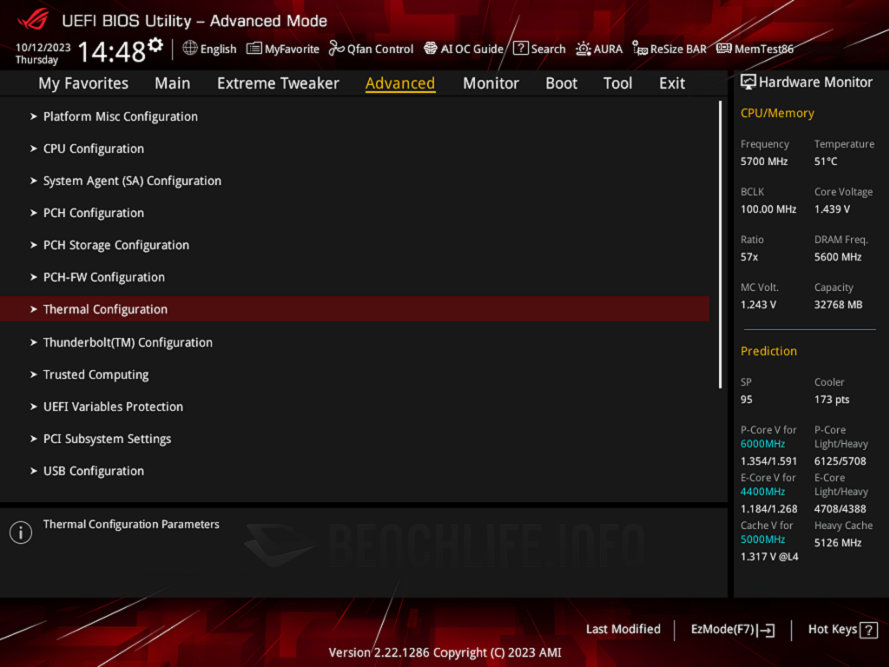
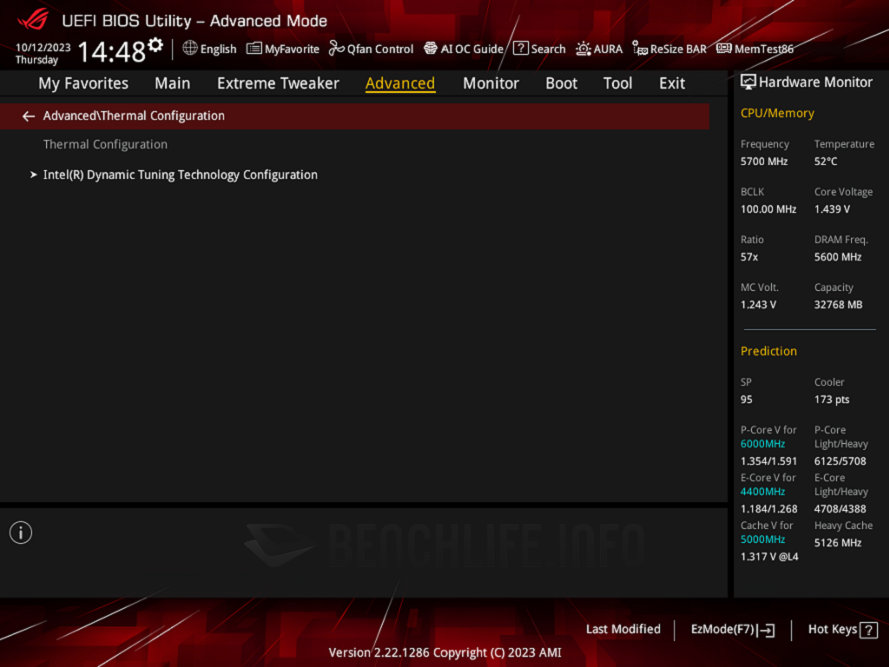
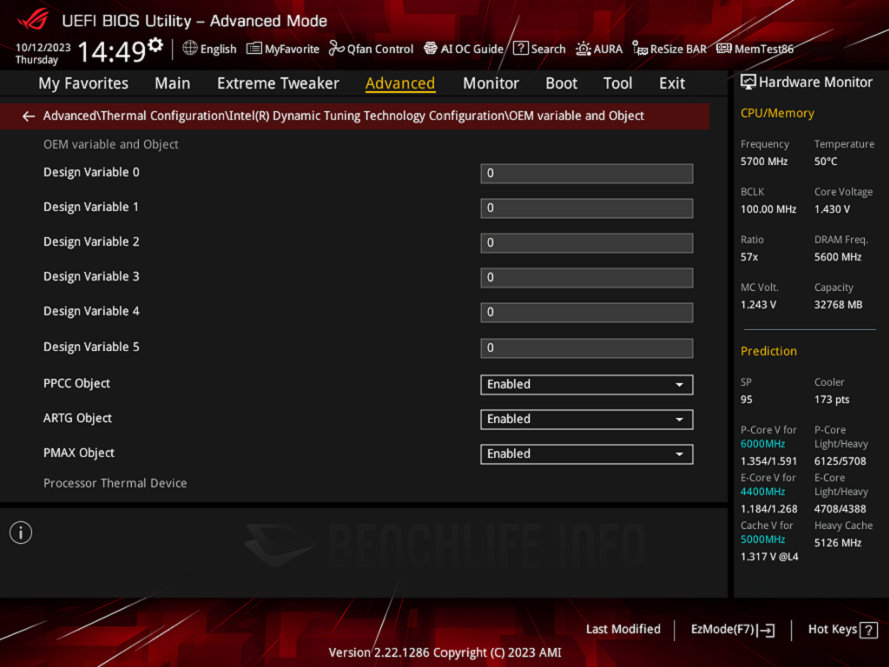
Intel Dynamic Tuning Technology(Intel DTT)则是源自Intel Adaptix的技术,让系统制造商能透过软件/驱动程序层,针对产品自定义热量/功率优化等策略。 这项功能过往常见行动平台搭载,Intel 酝酿导入到主板应该也有段时间,一般用户是没有去修改、调整的必要(相关选项看了也只是黑人问号… … )。
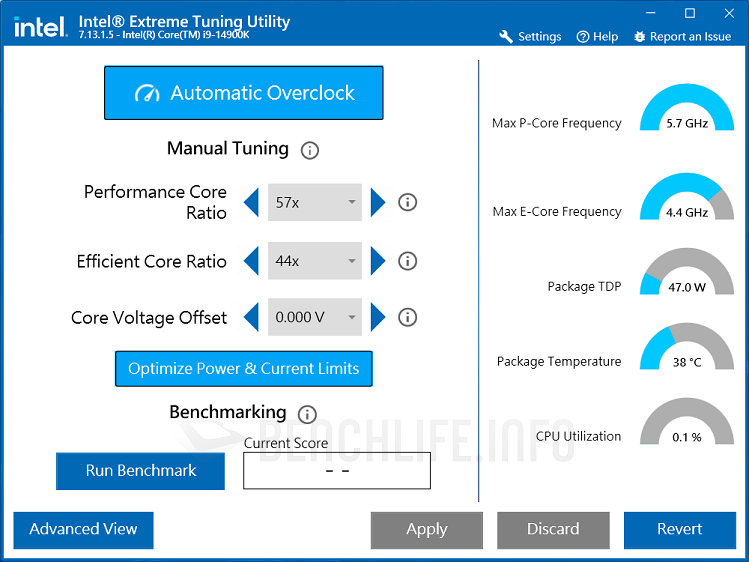
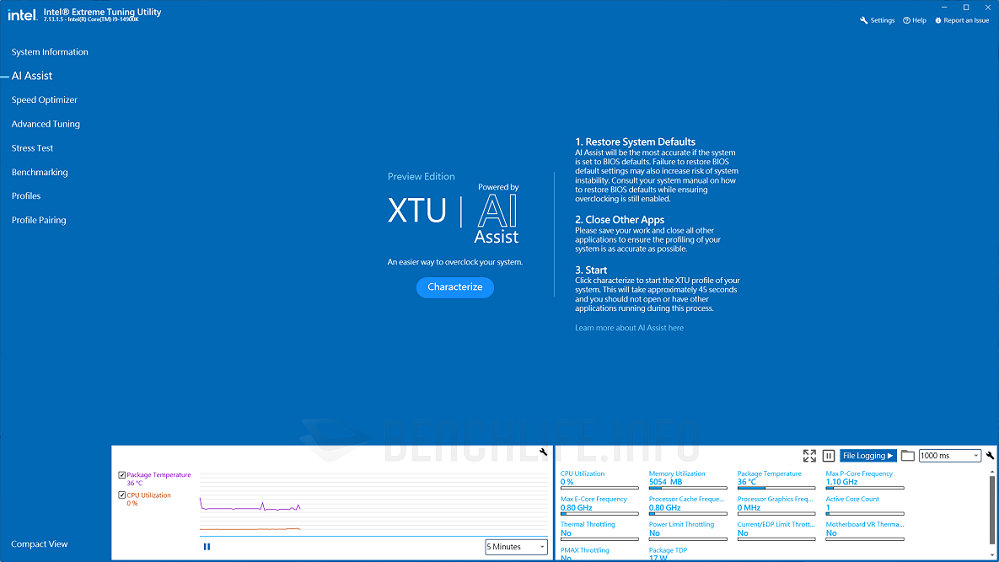
Intel 在评测指南也提到Intel AI Assist,这是内置于Intel Extreme Tuning Utility软件的新功能,当下也仅限支持Corei9-14900K/ KF。 这是通过 AI 人工智能模型 / 大数据分析统计方式,进一步发挥处理器超频潜力,亦可视为 Speed Optimizer 功能的 AI 版。
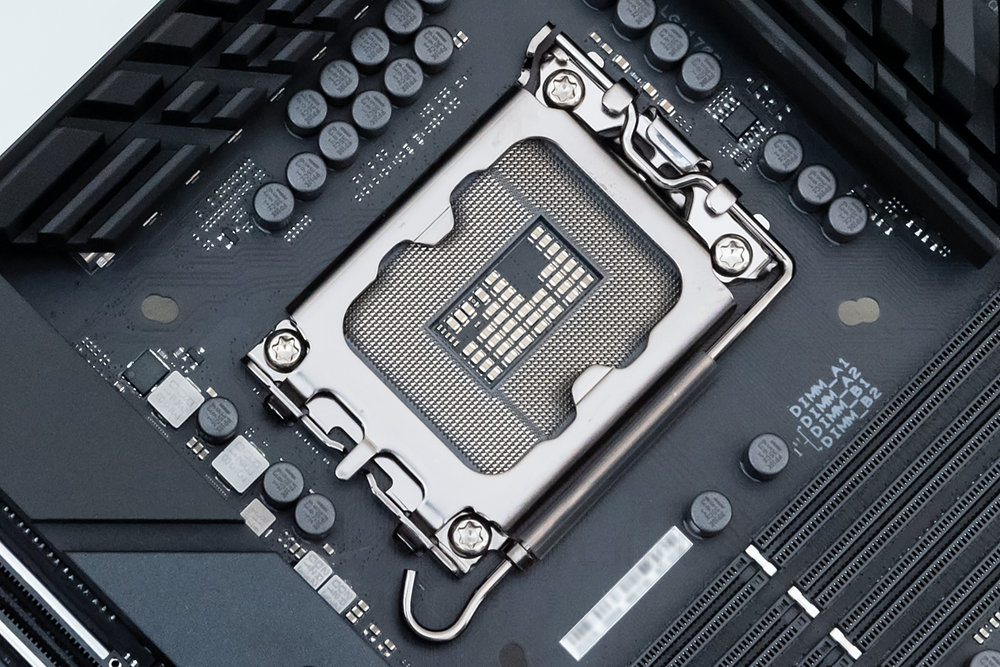
由于处理器骨子里相同,就不八百万字长篇赘述架构两三事,可以参考先前旧品的相关介绍。 那么在芯片组搭配部分,既有 600 与 700 系列的主板,更新 UEFI BIOS 即可获得支持。
主板厂也针对 700 系列产品进行 Refresh,稍早之前的开箱介绍提到,今年度开始导入 Wi-Fi 7 无线网络,可看到使用 Intel Wi-Fi 7 BE200,或是来自 Qualcomm、MediaTek 的模组产品。
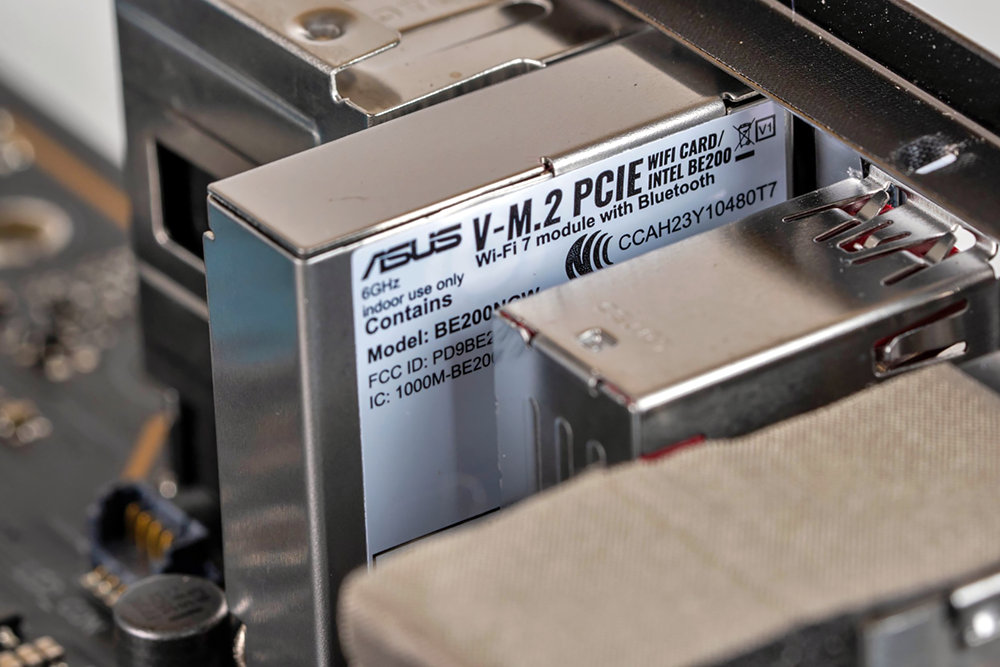
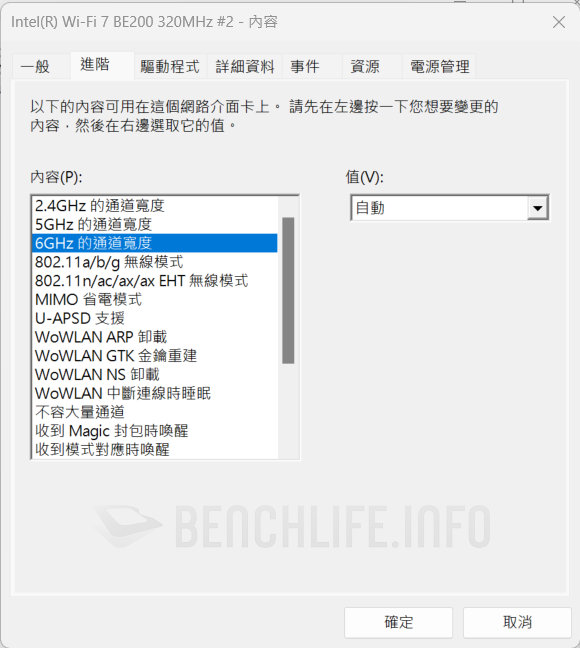
当然了,这些都属于Wi-Fi 7 Pre-cerified产品,演进步调如同当年Wi-Fi 6那样。 Wi-Fi 7支持2.4/5 /6GHz频段、320MHz带宽,前述模块基于2 x2天线配置,最高传输速率达5.8Gbps(Wi-Fi 6E /6为2.4Gbps)。
图例ASUS ROG Maximus Z790 Dark Hero是搭配Intel Wi-Fi 7 BE200无线网络模块。
就现实而言,主板对于运作配置的主导权,是凌驾在前述部分Intel重点诉求之上(ICCMax、Power Limit、… … )。 尽管Core i9-14900K / KF独享那些功能,但可用性与设置主要由主板决定,不讳言「真实」使用的差异可能有那么点无感。
ROG Maximus Z790 Dark Hero
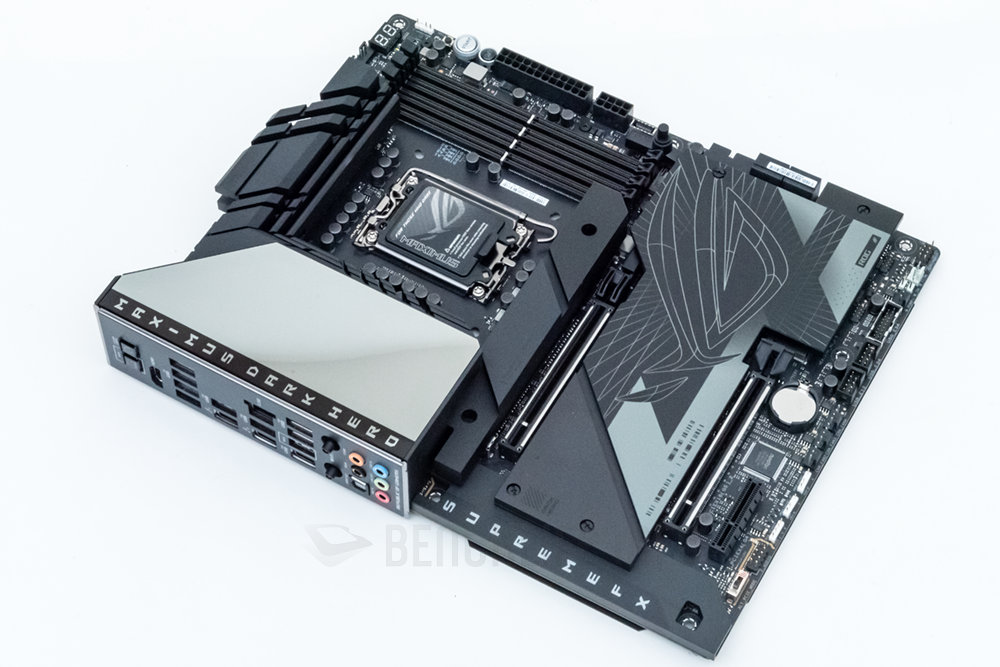
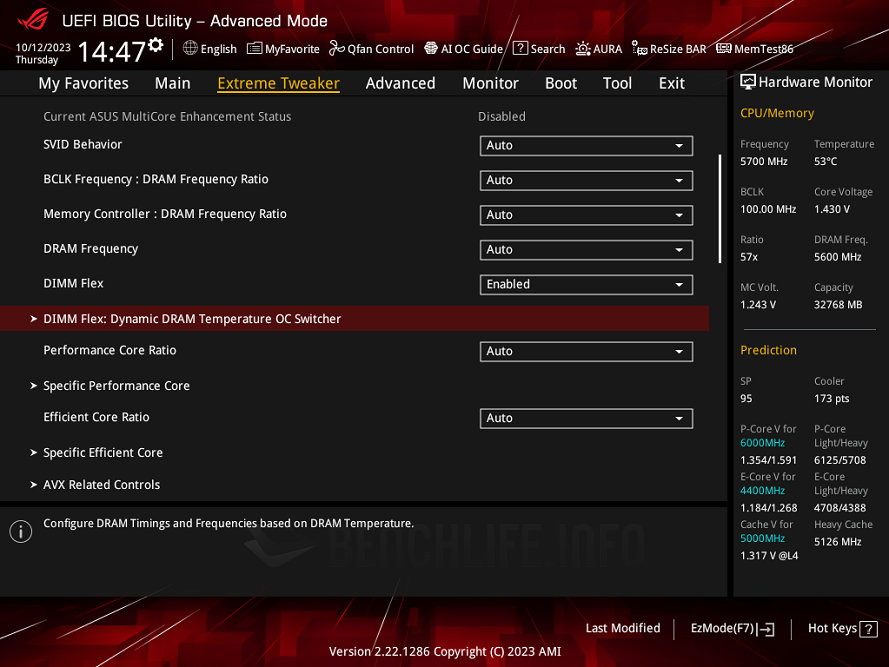
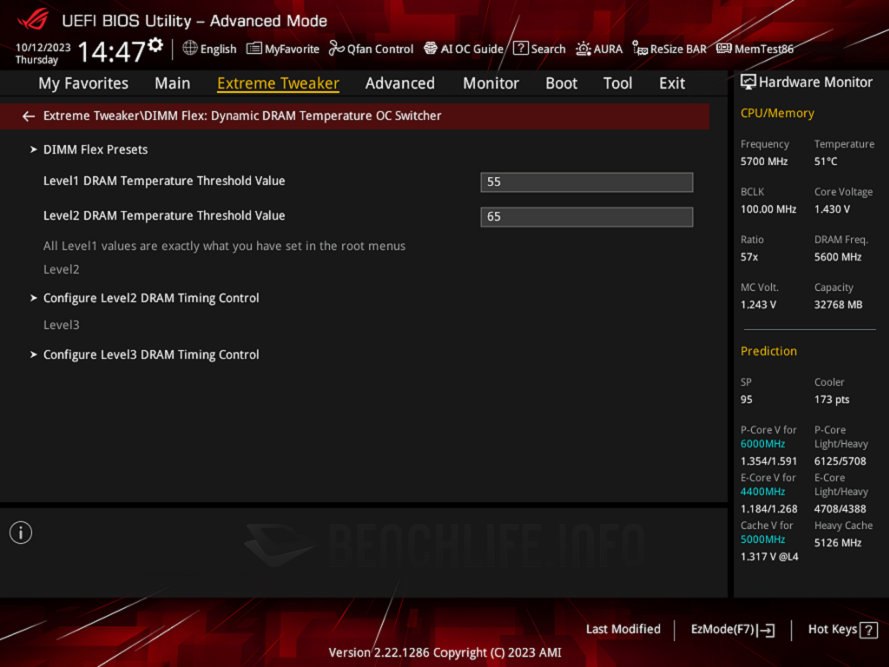
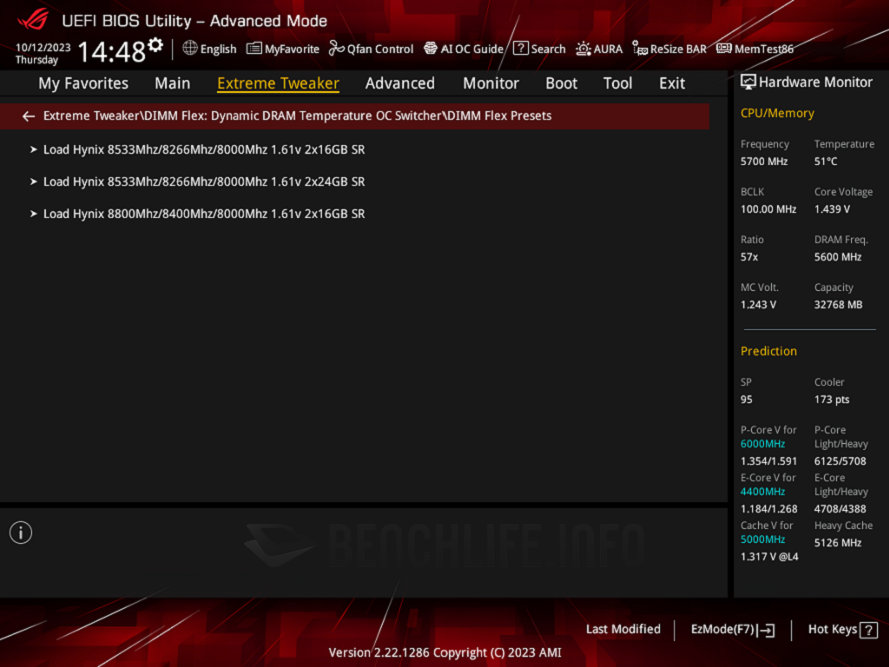
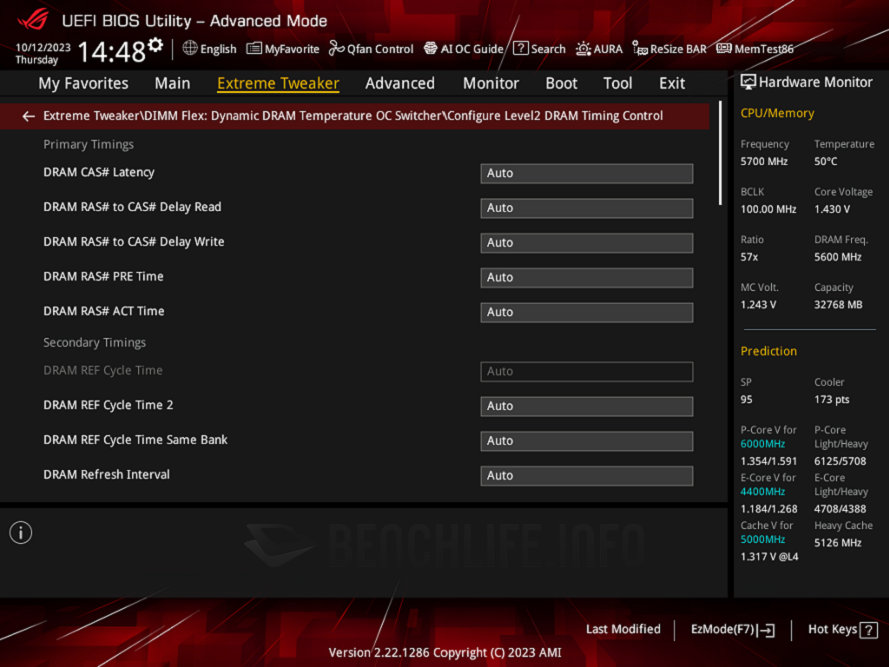
继续就ASUS ROG Maximus Z790 Dark Hero来看,其UEBI BIOS层包含DIMM Flex这项新功能,可以针对内存超频进行温度监控与自订标的,预设还提供SK Hynix颗粒模组试用的≥8000MT/s超频配置。
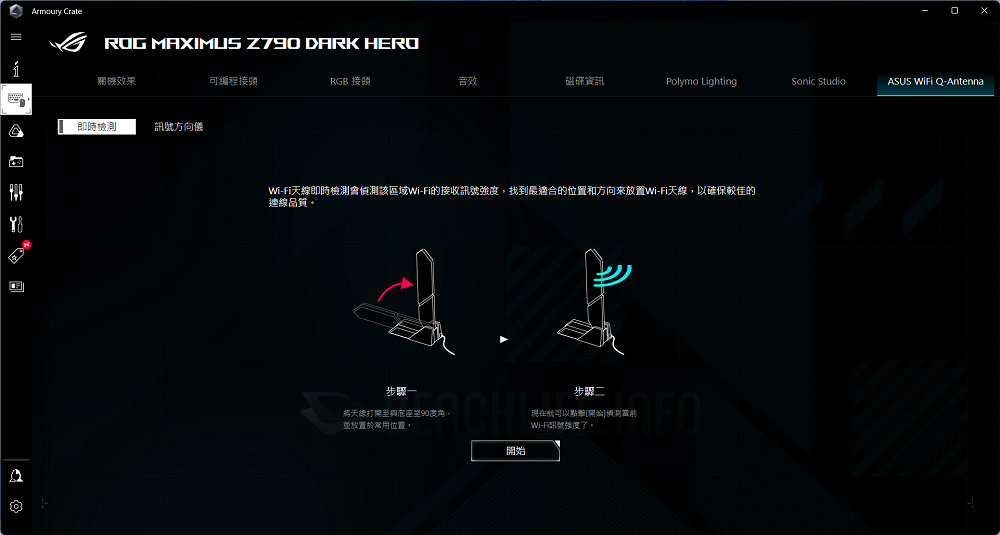
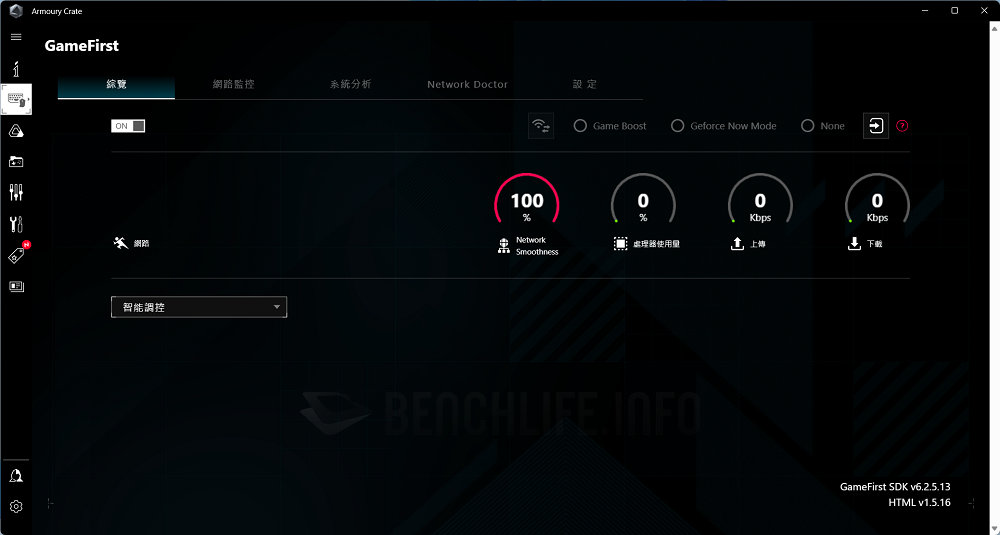
软件层在Armoury Crate新增ASUS Wi-Fi Q-Antenna功能,可以通过Wi-Fi信号强度检测/方向仪,找出天线较合适的摆放位置与方向,此外网络相关软件GameFirst也直接整合进Armoury Crate。
性能实测体验与比较
性能实测使用主板ASUS ROG Maximus Z790 Dark Hero(BIOS:0502),我们让UEFI BIOS维持在预设值,仅将ASUS MultiCore Enhancement选项调整为关闭,使处理器倍频与Power Limit以Intel预设值,而非ASUS优化的配置运作(默认Auto会将PL2放宽至4,095W)。
测试平台
- 处理器:Intel Core i9-14900K、Core i9-13900K、Core i5-14600K、Core i5-13600K
- 主板:ASUS ROG Maximus Z790 Dark Hero
- 内存:Crucial DDR5 Pro DDR5-5600 32GB Kit(CP2K16G56C46U5)
- 系统碟:Western Digital WD_BLACK SN850 1TB
- 显示卡:NVIDIA GeForce RTX 4090 Founders Edition
- 电源供应器:ASUS ROG Thor II 1000W
- 散热器:Noctua NH-D15S
- 显示器:ASUS TUF Gaming VG28UQL1A
- 操作系统:Microsoft Windows 11 Pro 64bit 22H2
在逻辑上应该是 Raptor Lake-S Refresh 的表现胜出,但主板各自优化设定、散热器解热性能、环境温度等诸多因素,都会左右新、旧世代同级产品的测试结果,那些微时脉差异未必能保证胜出,性能实测体验足以证明。
基于这样的但书或说原由,下列数据似乎也无须多做分析,Core i9-14900K对上Corei9-13900K、Corei5-14600K和Core i5-13600K新品表现很合理会稍好,但如果出现稍微落后之处也不用感到意外,这是真实使用可能遇到的状况。
| 运算性能类测试 | Core i9-14900K | Core i9-13900K | ± | |
|---|---|---|---|---|
| Sandra | ||||
| 算数处理器 – 总计功效 | MT + MC(GOPS) | 740.9 | 724.15 | 2.31 |
| 1T(GOPS) | 24.52 | 24.23 | 1.20 | |
| 多媒体处理器 – 总计功效 | MT + MC(GPixel/s) | 2.49 | 2.45 | 1.63 |
| 1T(MPixel/s) | 59.76 | 58.4 | 2.33 | |
| 加密解密处理器 – 密码学带宽 | MT + MC(GB/s) | 42.16 | 41.54 | 1.49 |
| 1T(GB/s) | 3.37 | 3.31 | 1.81 | |
| 财务分析 – 总期权定价的性能 | MT + MC(kOPT/s) | 255.88 | 255.7 | 0.07 |
| 1T(kOPT/s) | 8.79 | 8.61 | 2.09 | |
| 的科学分析 – 科学的绩效汇总 | MT + MC(GFLOPS) | 109.14 | 108.71 | 0.40 |
| 1T(GFLOPS) | 8.42 | 7.59 | 10.94 | |
| 处理器神经网络(AI/ML) – 神经网络聚合性能 | MT + MC(采样/秒) | 59.28 | 58.65 | 1.07 |
| 1T(采样/秒) | 1.63 | 1.62 | 0.62 | |
| 图像处理 – 图像处理的总速率 | MT + MC(GPixel/s) | 1.56 | 1.55 | 0.65 |
| 1T(MPixel/s) | 46.52 | 45.48 | 2.29 | |
| Geekbench 6 | ||||
| Multi-Core Performance | Multi-Core Score | 20933 | 20452 | 2.35 |
| Integer Socre | 19180 | 18756 | 2.26 | |
| Floating Point Socre | 24626 | 24018 | 2.53 | |
| Single-Core Performance | Single-Core Score | 3141 | 3015 | 4.18 |
| Integer Socre | 3047 | 2919 | 4.39 | |
| Floating Point Socre | 3323 | 3201 | 3.81 | |
| 3D Particle Movement | ||||
| Total Score (Mops/sec) | 6063.925 | 6023.47 | 0.67 | |
| 3DTrig (Mops/sec) | 992.2971 | 988.9011 | 0.34 | |
| BiPy (Mops/sec) | 2132.1853 | 2067.2153 | 3.14 | |
| P1rRjct (Mops/sec) | 1272.6261 | 1287.5038 | -1.16 | |
| Cosine (Mops/sec) | 514.0196 | 518.2162 | -0.81 | |
| HypCube (Mops/sec) | 720.8779 | 732.9833 | -1.65 | |
| NormDev (Mops/sec) | 431.9196 | 428.6499 | 0.76 | |
| y-cruncher | ||||
| Multi-Core | Total Computation Time(Sec) | 22.171 | 22.532 | 1.63 |
| Start-to End Wall Time(Sec) | 22.297 | 23.291 | 4.46 | |
| Single-Core | Total Computation Time(Sec) | 193.165 | 197.288 | 2.13 |
| Start-to End Wall Time(Sec) | 194.649 | 198.836 | 2.15 | |
| Dolphin | ||||
| Overall time(Sec) | 164 | 169 | 3.05 | |
| Time spent on meteor-contest(Sec) | 31 | 33 | 6.45 | |
| Time spent on n-body(Sec) | 37 | 39 | 5.41 | |
| Time spent on pi-digits(Sec) | 45 | 45 | 0.00 | |
| Time spent on spectral-norm(Sec) | 23 | 24 | 4.35 | |
| 7-Zip | ||||
| Compressing(GIPS) | 166.746 | 163.839 | 1.77 | |
| Decompressing(GIPS) | 220.387 | 217.9 | 1.14 | |
| Total Ratin(GIPS) | 193.716 | 190.87 | 1.49 | |
| WinRAR | ||||
| Benchmark(KB/s) | 50222 | 49026 | 2.44 | |
| AIDA64 Cache & Memory Benchmark | ||||
| DDR5-5600 | Read(MB/s) | 88210 | 85586 | 3.07 |
| Write(MB/s) | 77861 | 77241 | 0.80 | |
| (MB/s) | 78897 | 77414 | 1.92 | |
| Leatency(ns) | 82.1 | 82.8 | 0.85 | |
| Sandra | ||||
| 记忆体带宽 | 总体内存性能(GB/s) | 68.85 | 68.17 | 1.00 |
| 整数内存带宽 B/F AVX2/256(GB/s) | 68.39 | 67.16 | 1.83 | |
| 浮点数内存带宽 B/F FMA/256(GB/s) | 69.3 | 69.2 | 0.14 | |
| Core i9-14900K | Core i9-13900K | ± |
| 运算性能类测试 | Core i5-14600K | Core i5-13600K | ± | |
|---|---|---|---|---|
| Sandra | ||||
| 算数处理器 – 总计功效 | MT + MC(GOPS) | 484.88 | 456.86 | 6.13 |
| 1T(GOPS) | 23.6 | 21.56 | 9.46 | |
| 多媒体处理器 – 总计功效 | MT + MC(GPixel/s) | 1.55 | 1.52 | 1.97 |
| 1T(MPixel/s) | 54 | 53 | 1.89 | |
| 加密解密处理器 – 密码学带宽 | MT + MC(GB/s) | 30.86 | 30.09 | 2.56 |
| 1T(GB/s) | 3.14 | 3.1 | 1.29 | |
| 财务分析 – 总期权定价的性能 | MT + MC(kOPT/s) | 158.83 | 156.4 | 1.55 |
| 1T(kOPT/s) | 8 | 7.81 | 2.43 | |
| 的科学分析 – 科学的绩效汇总 | MT + MC(GFLOPS) | 86.16 | 83.25 | 3.50 |
| 1T(GFLOPS) | 7.55 | 7.42 | 1.75 | |
| 处理器神经网络(AI/ML) – 神经网络聚合性能 | MT + MC(采样/秒) | 43.93 | 41.42 | 6.06 |
| 1T(采样/秒) | 1.45 | 1.35 | 7.41 | |
| 图像处理 – 图像处理的总速率 | MT + MC(MPixel/s) | 997.14 | 960.46 | 3.82 |
| 1T(MPixel/s) | 42.14 | 41.22 | 2.23 | |
| Geekbench 6 | ||||
| Multi-Core Performance | Multi-Core Score | 17051 | 16582 | 2.83 |
| Integer Socre | 15612 | 15149 | 3.06 | |
| Floating Point Socre | 20086 | 19613 | 2.41 | |
| Single-Core Performance | Single-Core Score | 2793 | 2707 | 3.18 |
| Integer Socre | 2714 | 2625 | 3.39 | |
| Floating Point Socre | 2946 | 2866 | 2.79 | |
| 3D Particle Movement | ||||
| Total Score (Mops/sec) | 3741.08 | 3595.261 | 4.06 | |
| 3DTrig (Mops/sec) | 601.3708 | 580.6307 | 3.57 | |
| BiPy (Mops/sec) | 1345.3811 | 1284.1597 | 4.77 | |
| P1rRjct (Mops/sec) | 792.593 | 760.4235 | 4.23 | |
| Cosine (Mops/sec) | 308.5253 | 299.6265 | 2.97 | |
| HypCube (Mops/sec) | 434.5191 | 417.3849 | 4.11 | |
| NormDev (Mops/sec) | 258.6906 | 253.0362 | 2.23 | |
| y-cruncher | ||||
| Multi-Core | Total Computation Time(Sec) | 27.427 | 27.936 | 1.86 |
| Start-to End Wall Time(Sec) | 28.176 | 28.712 | 1.90 | |
| Single-Core | Total Computation Time(Sec) | 214.326 | 222.074 | 3.62 |
| Start-to End Wall Time(Sec) | 215.901 | 223.708 | 3.62 | |
| Dolphin | ||||
| Overall time(Sec) | 177 | 184 | 3.95 | |
| Time spent on meteor-contest(Sec) | 34 | 35 | 2.94 | |
| Time spent on n-body(Sec) | 41 | 42 | 2.44 | |
| Time spent on pi-digits(Sec) | 48 | 50 | 4.17 | |
| Time spent on spectral-norm(Sec) | 25 | 26 | 4.00 | |
| 7-Zip | ||||
| Compressing(GIPS) | 123.257 | 120.915 | 1.94 | |
| Decompressing(GIPS) | 134.577 | 125.079 | 7.59 | |
| Total Ratin(GIPS) | 128.917 | 122.997 | 4.81 | |
| WinRAR | ||||
| Benchmark(KB/s) | 33881 | 32927 | ||
| AIDA64 Cache & Memory Benchmark | ||||
| DDR5-5600 | Read(MB/s) | 81268 | 80703 | 0.70 |
| Write(MB/s) | 77748 | 77367 | 0.49 | |
| (MB/s) | 76420 | 75256 | 1.55 | |
| Leatency(ns) | 81.3 | 84.1 | 3.44 | |
| Sandra | 65.6 | |||
| 记忆体带宽 | 总体内存性能(GB/s) | 65.6 | 65.37 | 0.35 |
| 整数内存带宽 B/F AVX2/256(GB/s) | 64.72 | 64.67 | 0.08 | |
| 浮点数内存带宽 B/F FMA/256(GB/s) | 66.54 | 66 | 0.82 | |
| Core i5-14600K | Core i5-13600K | ± |
| 视频处理类测试(AI) | Core i9-14900K | Core i9-13900K | ± | |
|---|---|---|---|---|
| Nero Score | ||||
| Score | 15292 | 15002 | 1.93 | |
| CPU Score | 3073 | 2864 | 7.30 | |
| AI Tagging | 3520 | 3241 | 8.61 | |
| AVC Decoding & Encoding | 2625 | 2487 | 5.55 | |
| GPU Score – RTX 4090 | 12219 | 12138 | 0.67 | |
| AVC Decoding & Encoding | 5682 | 5655 | 0.48 | |
| Metaverse | 18755 | 18620 | 0.73 | |
| Topaz Video AI Benchmark:4K | ||||
| Artemis 1X(fps) | 8.72 | 8.62 | 1.16 | |
| Iris 1X(fps) | 8.94 | 8.66 | 3.23 | |
| Proteus 1X(fps) | 7.49 | 7.41 | 1.08 | |
| Gaja 1X(fps) | 3.39 | 3.39 | 0.00 | |
| Nyx 1X(fps) | 2.94 | 2.94 | 0.00 | |
| 4X Slowmo | Apollo(fps) | 17.01 | 16.87 | 0.83 |
| APFast(fps) | 21.63 | 22.64 | -4.46 | |
| Chronos(fps) | 7.18 | 7.17 | 0.14 | |
| CHFast(fps) | 12.95 | 13.07 | -0.92 | |
| Topaz Video AI Benchmark:FHD | ||||
| Artemis 1X(fps) | 43.57 | 41.55 | 4.86 | |
| Iris 1X(fps) | 41.1 | 43.83 | -6.23 | |
| Proteus 1X(fps) | 38.13 | 37.83 | 0.79 | |
| Gaja 1X(fps) | 15.91 | 15.93 | -0.13 | |
| Nyx 1X(fps) | 17.72 | 17.76 | -0.23 | |
| 4X Slowmo | Apollo(fps) | 42.89 | 39.56 | 8.42 |
| APFast(fps) | 75.92 | 77.33 | -1.82 | |
| Chronos(fps) | 32.44 | 32.42 | 0.06 | |
| CHFast(fps) | 34.57 | 33.7 | 2.58 | |
| Core i9-14900K | Core i9-13900K | ± |
| 视频处理类测试(AI) | Core i5-14600K | Core i5-13600K | ± | |
|---|---|---|---|---|
| Nero Score | ||||
| Score | 14853 | 14756 | 0.66 | |
| CPU Score | 2714 | 2610 | 3.98 | |
| AI Tagging | 2917 | 2836 | 2.86 | |
| AVC Decoding & Encoding | 2510 | 2384 | 5.29 | |
| GPU Score – RTX 4090 | 12139 | 12146 | -0.06 | |
| AVC Decoding & Encoding | 5645 | 5620 | 0.44 | |
| Metaverse | 18633 | 18672 | -0.21 | |
| Topaz Video AI Benchmark:4K | ||||
| Artemis 1X(fps) | 8.78 | 8.43 | 4.15 | |
| Iris 1X(fps) | 8.63 | 8.68 | -0.58 | |
| Proteus 1X(fps) | 7.42 | 7.72 | -3.89 | |
| Gaja 1X(fps) | 3.38 | 3.39 | -0.29 | |
| Nyx 1X(fps) | 2.93 | 2.93 | 0.00 | |
| 4X Slowmo | Apollo(fps) | 16.5 | 16.39 | 0.67 |
| APFast(fps) | 21.89 | 20.56 | 6.47 | |
| Chronos(fps) | 7.15 | 7.11 | 0.56 | |
| CHFast(fps) | 12.33 | 13.08 | -5.73 | |
| Topaz Video AI Benchmark:FHD | ||||
| Artemis 1X(fps) | 43.17 | 43.42 | -0.58 | |
| Iris 1X(fps) | 42.47 | 40.7 | 4.35 | |
| Proteus 1X(fps) | 37.22 | 32.41 | 14.84 | |
| Gaja 1X(fps) | 15.81 | 15.84 | -0.19 | |
| Nyx 1X(fps) | 17.73 | 17.8 | -0.39 | |
| 4X Slowmo | Apollo(fps) | 38.46 | 38.82 | -0.93 |
| APFast(fps) | 74.27 | 77.84 | -4.59 | |
| Chronos(fps) | 32.21 | 32.49 | -0.86 | |
| CHFast(fps) | 33.41 | 32.61 | 2.45 | |
| Core i5-14600K | Core i5-13600K | ± |
| 图形渲染类测试 | Core i9-14900K | Core i9-13900K | ± | |
|---|---|---|---|---|
| Cinebench 2024 | ||||
| GPU – RTX 4090(pts) | 36090 | 35203 | 2.52 | |
| CPU – Multi Core(pts) | 2101 | 2072 | 1.40 | |
| CPU – Single Core(pts) | 134 | 129 | 3.88 | |
| Blender | ||||
| CPU | monster | 248.79923 | 243.918934 | 2.00 |
| junkshop | 156.565451 | 154.288369 | 1.48 | |
| classrom | 117.710569 | 114.602016 | 2.71 | |
| dGPU – RTX 4090 | monster | 6869.084892 | 6865.097602 | 0.06 |
| junkshop | 3252.225761 | 3237.122733 | 0.47 | |
| classrom | 3174.769578 | 3198.119754 | -0.73 | |
| Corona 10 Benchmark | ||||
| Score(rays/s) | 12057143 | 11870285 | 1.57 | |
| Indigo Bench | ||||
| CPU | Bedroom(M samples/s) | 4.028 | 3.932 | 2.44 |
| Supercar(M samples/s) | 11.897 | 11.655 | 2.08 | |
| dGPU – RTX 4090 | Bedroom(M samples/s) | 35.267 | 35.286 | -0.05 |
| Supercar(M samples/s) | 77.735 | 76.101 | 2.15 | |
| POV-Ray | ||||
| All CPU’s(pps) | 12465.83 | 12381.64 | 0.68 | |
| One CPU(pps) | 862.04 | 831.75 | 3.64 | |
| Core i9-14900K | Core i9-13900K | ± |
| 图形渲染类测试 | Core i5-14600K | Core i5-13600K | ± | |
|---|---|---|---|---|
| Cinebench 2024 | ||||
| GPU – RTX 4090(pts) | 35346 | 33984 | 4.01 | |
| CPU – Multi Core(pts) | 1337 | 1311 | 1.98 | |
| CPU – Single Core(pts) | 119 | 116 | 2.59 | |
| Blender | ||||
| CPU | monster | 151.207747 | 147.825645 | 2.29 |
| junkshop | 96.470366 | 94.290822 | 2.31 | |
| classrom | 73.438193 | 71.456283 | 2.77 | |
| dGPU – RTX 4090 | monster | 6877.909574 | 6836.339654 | 0.61 |
| junkshop | 3248.577609 | 3242.181593 | 0.20 | |
| classrom | 3194.130783 | 3180.698977 | 0.42 | |
| Corona 10 Benchmark | ||||
| Score(rays/s) | 7592414 | 7364506 | 3.09 | |
| Indigo Bench | ||||
| CPU | Bedroom(M samples/s) | 2.516 | 2.434 | 3.37 |
| Supercar(M samples/s) | 7.184 | 6.907 | 4.01 | |
| dGPU – RTX 4090 | Bedroom(M samples/s) | 35.155 | 35.127 | 0.08 |
| Supercar(M samples/s) | 77.557 | 77.308 | 0.32 | |
| POV-Ray | ||||
| All CPU’s(pps) | 8177.94 | 7824.73 | 4.51 | |
| One CPU(pps) | 772.36 | 746.29 | 3.49 | |
| Core i5-14600K | Core i5-13600K | ± |
| 综合生产力测试 | Core i9-14900K | Core i9-13900K | ± | |
|---|---|---|---|---|
| CrossMark | ||||
| Overall Score | 2676 | 2545 | 5.15 | |
| Productivity | 2511 | 2378 | 5.59 | |
| Creativity | 2831 | 2717 | 4.20 | |
| Responsiveness | 2739 | 2562 | 6.91 | |
| WebXPRT 4 | ||||
| Score | 376 | 368 | 2.17 | |
| Photo Enhancement(ms) | 221 | 224 | 1.36 | |
| Organize Album using AI(ms) | 1003 | 1029 | 2.59 | |
| Stock Option Pricing(ms) | 58 | 59 | 1.72 | |
| Encrypt Notes and OCR Scan(ms) | 619 | 636 | 2.75 | |
| Sales Graphs(ms) | 154 | 156 | 1.30 | |
| Online Homework(ms) | 1128 | 1173 | 3.99 | |
| PCMark 10 Extended | ||||
| Score | 14880 | 14362 | 3.61 | |
| Essentials | Score | 12750 | 12397 | 2.85 |
| App Start-up Score | 20795 | 19420 | 7.08 | |
| Video Conferencing Score | 8380 | 8375 | 0.06 | |
| Web Browsing Score | 11895 | 11717 | 1.52 | |
| Productivity | Score | 13532 | 13016 | 3.96 |
| Spreadsheets Score | 17665 | 17004 | 3.89 | |
| Writing Score | 10367 | 9964 | 4.04 | |
| Digital Content Creation | Score | 18723 | 18354 | 2.01 |
| Photo Editing Score | 25785 | 26084 | -1.15 | |
| Rendering and Visualization Score | 26937 | 26834 | 0.38 | |
| Video Editing Score | 9450 | 8834 | 6.97 | |
| Gaming | Score | 41007 | 38814 | 5.65 |
| Graphics score | 67086 | 62959 | 6.56 | |
| Physics score | 55525 | 54238 | 2.37 | |
| Combined score | 15489 | 14687 | 5.46 | |
| Procyon Office Productivity | ||||
| Office Productivity score | 9152 | 9023 | 1.43 | |
| Office Productivity MP score | 302000 | 299000 | 1.00 | |
| Word socre | 8657 | 9167 | -5.56 | |
| Excel socre | 9206 | 8921 | 3.19 | |
| PowerPoint socre | 9643 | 9258 | 4.16 | |
| Outlook score | 9109 | 8499 | 7.18 | |
| Word MP socre | 362000 | 381000 | -4.99 | |
| Excel MP socre | 221000 | 214000 | 3.27 | |
| PowerPoint MP socre | 346000 | 330000 | 4.85 | |
| Procyon Photo Editing Benchmark | ||||
| Photo Editing Benchmark score | 10918 | 10671 | 2.31 | |
| Image Retouching score | 9748 | 11752 | -17.05 | |
| Batch Processing score | 12229 | 9691 | 26.19 | |
| Procyon Video Editing | ||||
| Video Editing score | 10420 | 10203 | 2.13 | |
| Core i9-14900K | Core i9-13900K | ± |
| 综合生产力测试 | Core i5-14600K | Core i5-13600K | ± | |
|---|---|---|---|---|
| CrossMark | ||||
| Overall Score | 2323 | 2313 | 0.43 | |
| Productivity | 2213 | 2187 | 1.19 | |
| Creativity | 2417 | 2445 | -1.15 | |
| Responsiveness | 2386 | 2319 | 2.89 | |
| WebXPRT 4 | ||||
| Score | 349 | 340 | 2.65 | |
| Photo Enhancement(ms) | 231 | 237 | 2.60 | |
| Organize Album using AI(ms) | 1081 | 1118 | 3.42 | |
| Stock Option Pricing(ms) | 62 | 63 | 1.61 | |
| Encrypt Notes and OCR Scan(ms) | 671 | 697 | 3.87 | |
| Sales Graphs(ms) | 162 | 166 | 2.47 | |
| Online Homework(ms) | 1274 | 1298 | 1.88 | |
| PCMark 10 Extended | ||||
| Score | 14164 | 13900 | 1.90 | |
| Essentials | Score | 11851 | 11599 | 2.17 |
| App Start-up Score | 19019 | 18175 | 4.64 | |
| Video Conferencing Score | 7698 | 7642 | 0.73 | |
| Web Browsing Score | 11369 | 11238 | 1.17 | |
| Productivity | Score | 12553 | 12097 | 3.77 |
| Spreadsheets Score | 16256 | 15740 | 3.28 | |
| Writing Score | 9695 | 9298 | 4.27 | |
| Digital Content Creation | Score | 16779 | 16797 | -0.11 |
| Photo Editing Score | 22740 | 23824 | -4.55 | |
| Rendering and Visualization Score | 24074 | 23503 | 2.43 | |
| Video Editing Score | 8630 | 8465 | 1.95 | |
| Gaming | Score | 435462 | 42797 | 917.51 |
| Graphics score | 85167 | 84210 | 1.14 | |
| Physics score | 38138 | 36841 | 3.52 | |
| Combined score | 15612 | 15363 | 1.62 | |
| Procyon Office Productivity | ||||
| Office Productivity score | 8520 | 8338 | 2.18 | |
| Office Productivity MP score | 282000 | 275000 | 2.55 | |
| Word socre | 8485 | 8334 | 1.81 | |
| Excel socre | 8267 | 8148 | 1.46 | |
| PowerPoint socre | 8934 | 8719 | 2.47 | |
| Outlook score | 8302 | 7998 | 3.80 | |
| Word MP socre | 355000 | 345000 | 2.90 | |
| Excel MP socre | 197000 | 195000 | 1.03 | |
| PowerPoint MP socre | 321000 | 312000 | 2.88 | |
| Procyon Photo Editing Benchmark | ||||
| Photo Editing Benchmark score | 10046 | 9729 | 3.26 | |
| Image Retouching score | 10749 | 10501 | 2.36 | |
| Batch Processing score | 9390 | 9015 | 4.16 | |
| Procyon Video Editing | ||||
| Video Editing score | 9678 | 9498 | 1.90 | |
| Core i5-14600K | Core i5-13600K | ± |
| 3DMark 測試 | Core i9-14900K | Core i9-13900K | ± | |
|---|---|---|---|---|
| Speed Way Score | Score | 10105 | 10103 | 0.02 |
| Port Royal | Score | 25893 | 25881 | 0.05 |
| Time Spy Extreme | Score | 18214 | 18142 | 0.40 |
| Graphics score | 19496 | 19460 | 0.18 | |
| CPU score | 13270 | 13111 | 1.21 | |
| Time Spy | Score | 33716 | 33569 | 0.44 |
| Graphics score | 37300 | 37259 | 0.11 | |
| CPU score | 21830 | 21502 | 1.53 | |
| Fire Strike Ultra | Score | 24402 | 24168 | 0.97 |
| Graphics score | 24021 | 24008 | 0.05 | |
| Physics score | 55651 | 54343 | 2.41 | |
| Combined socre | 14162 | 13558 | 4.45 | |
| Fire Strike Extreme | Score | 38576 | 37660 | 2.43 |
| Graphics score | 44202 | 44171 | 0.07 | |
| Physics score | 55856 | 54151 | 3.15 | |
| Combined socre | 15950 | 14698 | 8.52 | |
| Fire Strike | Score | 47552 | 47416 | 0.29 |
| Graphics score | 63290 | 64817 | -2.36 | |
| Physics score | 55726 | 54174 | 2.86 | |
| Combined socre | 15414 | 14815 | 4.04 | |
| CPU Profile | Max threads | 16829 | 16646 | 1.10 |
| 16-threads | 12018 | 11677 | 2.92 | |
| 8-threads | 9103 | 8776 | 3.73 | |
| 4-threads | 4849 | 4684 | 3.52 | |
| 2-threads | 2451 | 2361 | 3.81 | |
| 1-threads | 1259 | 1199 | 5.00 | |
| Core i9-14900K | Core i9-13900K | ± |
| 3DMark 测试 | Core i5-14600K | Core i5-13600K | ± | |
|---|---|---|---|---|
| Speed Way Score | Score | 10066 | 10042 | 0.24 |
| Port Royal | Score | 25971 | 25956 | 0.06 |
| Time Spy Extreme | Score | 16066 | 16060 | 0.04 |
| Graphics score | 19514 | 19552 | -0.19 | |
| CPU score | 8028 | 7983 | 0.56 | |
| Time Spy | Score | 32132 | 32021 | 0.35 |
| Graphics score | 37211 | 37219 | -0.02 | |
| CPU score | 18119 | 17875 | 1.37 | |
| Fire Strike Ultra | Score | 24039 | 23964 | 0.31 |
| Graphics score | 24388 | 24307 | 0.33 | |
| Physics score | 38340 | 39744 | -3.53 | |
| Combined socre | 14406 | 14086 | 2.27 | |
| Fire Strike Extreme | Score | 37551 | 37485 | 0.18 |
| Graphics score | 44990 | 44906 | 0.19 | |
| Physics score | 38434 | 39615 | -2.98 | |
| Combined socre | 16510 | 16158 | 2.18 | |
| Fire Strike | Score | 51063 | 49412 | 3.34 |
| Graphics score | 79193 | 79138 | 0.07 | |
| Physics score | 38189 | 38377 | -0.49 | |
| Combined socre | 16168 | 14594 | 10.79 | |
| CPU Profile | Max threads | 10668 | 10467 | 1.92 |
| 16-threads | 9856 | 9672 | 1.90 | |
| 8-threads | 7461 | 7236 | 3.11 | |
| 4-threads | 4501 | 4349 | 3.50 | |
| 2-threads | 2270 | 2192 | 3.56 | |
| 1-threads | 1129 | 1093 | 3.29 | |
| Core i5-14600K | Core i5-13600K | ± |
| 游戏测试:最高贴图质量、平均 FPS | Resolution | Core i9-14900K | Core i9-13900K |
|---|---|---|---|
| Ashes of the Singularity: Escalation | 4K | 150.6 | 150.3 |
| FHD | 159.1 | 154.4 | |
| Call of Duty – Modern Warfare II | 4K | 143 | 141 |
| FHD | 256 | 254 | |
| Cyberpunk 2077 | 4K | 82.43 | 81.85 |
| FHD | 208.73 | 203.9 | |
| Dirt 5 | 4K | 187 | 186.2 |
| FHD | 294.5 | 289 | |
| F1 22 | 4K | 227 | 226 |
| FHD | 391 | 390 | |
| FarCry 6 | 4K | 141 | 140 |
| FHD | 192 | 183 | |
| Forza Horizon 5 | 4K | 154 | 154 |
| FHD | 213 | 209 | |
| Gears Tactics | 4K | 177.7 | 175.06 |
| FHD | 328.1 | 319.3 | |
| Immortals Fenyx Rising | 4K | 123 | 123 |
| FHD | 181 | 181 | |
| Tom Clancy’s Rainbow Six Extraction | 4K | 205 | 203 |
| FHD | 270 | 262 | |
| World Of Tanks enCORE Benchmark(Score) | 4K | 52533 | 52530 |
| FHD | 120405 | 118339 | |
| Core i9-14900K | Core i9-13900K |
| 游戏测试:最高贴图质量、平均 FPS | Resolution | Core i5-14600K | Core i5-13600K |
|---|---|---|---|
| Ashes of the Singularity: Escalation | 4K | 146 | 141.1 |
| FHD | 149 | 148.9 | |
| Call of Duty – Modern Warfare II | 4K | 143 | 141 |
| FHD | 250 | 247 | |
| Cyberpunk 2077 | 4K | 81.42 | 81.09 |
| FHD | 191.4 | 186.83 | |
| Dirt 5 | 4K | 186.1 | 185.9 |
| FHD | 286.4 | 282 | |
| F1 22 | 4K | 227 | 224 |
| FHD | 353 | 341 | |
| FarCry 6 | 4K | 138 | 136 |
| FHD | 167 | 165 | |
| Forza Horizon 5 | 4K | 154 | 153 |
| FHD | 202 | 202 | |
| Gears Tactics | 4K | 171.9 | 166.8 |
| FHD | 242.9 | 235.6 | |
| Immortals Fenyx Rising | 4K | 123 | 122 |
| FHD | 179 | 179 | |
| Tom Clancy’s Rainbow Six Extraction | 4K | 203 | 200 |
| FHD | 242 | 239 | |
| World Of Tanks enCORE Benchmark(Score) | 4K | 52259 | 52119 |
| FHD | 118192 | 112864 | |
| Core i5-14600K | Core i5-13600K |
总和而言,第 14 代 Intel Core 桌上型处理器(Raptor Lake-S Refresh),不讳言只是第 13 代(Raptor Lake-S)的时脉微调、再最佳化版本,它够不够格称之为第 14 代,见仁见智吧。
尽管Intel着力处并未局限在硬件,他们试图从韧、软件层导入新机能,使性能发挥与使用体验能更精进。 只不过残酷的现实如前述,一些新功能可能由 Core i9-14900K / KF 独享,使得这代微更新的吸引力被稀释。
你觉得如何呢?